AI · Knowledge Infrastructure
GraphRAG
Hybrid retrieval architecture combining knowledge graph traversal with vector similarity search and LLM inference.
The Challenge
Beyond
flat retrieval.
Traditional RAG systems retrieve document chunks based purely on vector similarity — effective for simple lookups, but fundamentally limited when queries require understanding relationships between entities. A question like "How does Entity A relate to Entity B through Entity C?" demands graph-level reasoning that flat vector search cannot provide.
The objective was to engineer a hybrid retrieval system that combines the relational reasoning of knowledge graphs with the semantic power of vector embeddings, unified under a single LLM-powered query interface.
The Architecture
Graph + Vector
fusion.
Document Ingestion Pipeline
PDF and text document upload with semantic chunking. Each chunk is simultaneously embedded into FAISS vector space and parsed for named entities and relationships to construct the knowledge graph.
Knowledge Graph (NetworkX)
Entities extracted from documents form graph nodes. Relationships between entities form edges with typed labels. Graph traversal enables multi-hop reasoning that vector search alone cannot achieve.
Vector Index (FAISS)
Document chunks embedded via sentence transformers and indexed in FAISS for sub-millisecond approximate nearest-neighbor retrieval. Serves as the semantic similarity backbone.
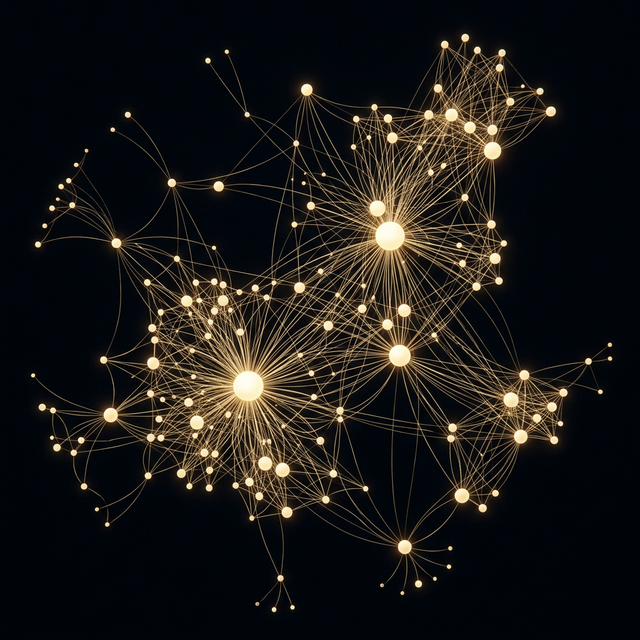
D3.js Graph Visualization
Interactive force-directed graph rendering in the browser. Users can visually explore entity relationships, hover for details, and understand the knowledge topology at a glance.
The Outcome
Relational
intelligence.
The hybrid architecture enables queries that neither a pure vector database nor a pure knowledge graph could answer alone. Groq LLM inference synthesizes context from both retrieval paths into coherent, grounded responses. The D3.js visualization transforms abstract data relationships into intuitive, explorable topology maps.